Telemetry Guide
At GitLab, we collect product usage data for the purpose of helping us build a better product. Data helps GitLab understand which parts of the product need improvement and which features we should build next. Product usage data also helps our team better understand the reasons why people use GitLab. With this knowledge we are able to make better product decisions.
We encourage users to enable tracking, and we embrace full transparency with our tracking approach so it can be easily understood and trusted.
By enabling tracking, users can:
- Contribute back to the wider community.
- Help GitLab improve on the product.
Our tracking tools
We use three methods to gather product usage data:
Snowplow
Snowplow is an enterprise-grade marketing and product analytics platform which helps track the way users engage with our website and application.
Snowplow consists of two components:
- Snowplow JS tracks client-side events.
- Snowplow Ruby tracks server-side events.
For more details, read the Snowplow guide.
Usage Ping
Usage Ping is a method for GitLab Inc to collect usage data on a GitLab instance. Usage Ping is primarily composed of row counts for different tables in the instance’s database. By comparing these counts month over month (or week over week), we can get a rough sense for how an instance is using the different features within the product. This high-level data is used to help our product, support, and sales teams.
For more details, read the Usage Ping guide.
Database import
Database imports are full imports of data into GitLab's data warehouse. For GitLab.com, the PostgreSQL database is loaded into Snowflake data warehouse every 6 hours. For more details, see the data team handbook.
What data can be tracked
Our different tracking tools allows us to track different types of events. The event types and examples of what data can be tracked are outlined below.
The availability of event types and their tracking tools varies by segment. For example, on Self-Managed Users, we only have reporting using Database records via Usage Ping.
| Event Types | SaaS Instance | SaaS Plan | SaaS Group | SaaS Session | SaaS User | SM Instance | SM Plan | SM Group | SM Session | SM User |
|---|---|---|---|---|---|---|---|---|---|---|
| Snowplow (JS Pageview events) | ||||||||||
| Snowplow (JS UI events) | ||||||||||
| Snowplow (Ruby Pageview events) | ||||||||||
| Snowplow (Ruby CRUD / API events) | ||||||||||
| Usage Ping (Redis UI counters) |
|
|
||||||||
| Usage Ping (Redis Pageview counters) |
|
|
||||||||
| Usage Ping (Redis CRUD / API counters) |
|
|
||||||||
| Usage Ping (Database counters) |
|
|
||||||||
| Usage Ping (Instance settings) |
|
|
||||||||
| Usage Ping (Integration settings) |
|
|
||||||||
| Database import (Database records) |
|
|
|
|
|
|
Legend
SaaS = GitLab.com. SM = Self-Managed instance
Pageview events
- Number of sessions that visited the /dashboard/groups page
UI events
- Number of sessions that clicked on a button or link
- Number of sessions that closed a modal
UI events are any interface-driven actions from the browser including click data.
CRUD or API events
- Number of Git pushes
- Number of GraphQL queries
- Number of requests to a Rails action or controller
These are backend events that include the creation, read, update, deletion of records, and other events that might be triggered from layers other than those available in the interface.
Database records
These are raw database records which can be explored using business intelligence tools like Sisense. The full list of available tables can be found in structure.sql.
Instance settings
These are settings of your instance such as the instance's Git version and if certain features are enabled such as container_registry_enabled.
Integration settings
These are integrations your GitLab instance interacts with such as an external storage provider or an external container registry. These services must be able to send data back into a GitLab instance for data to be tracked.
Reporting level
Our reporting levels of aggregate or individual reporting varies by segment. For example, on Self-Managed Users, we can report at an aggregate user level using Usage Ping but not on an Individual user level.
| Aggregated Reporting | SaaS Instance | SaaS Plan | SaaS Group | SaaS Session | SaaS User | SM Instance | SM Plan | SM Group | SM Session | SM User |
|---|---|---|---|---|---|---|---|---|---|---|
| Snowplow | ||||||||||
| Usage Ping | ||||||||||
| Database import |
|
|
|
|
|
|
| Identifiable Reporting | SaaS Instance | SaaS Plan | SaaS Group | SaaS Session | SaaS User | SM Instance | SM Plan | SM Group | SM Session | SM User |
|---|---|---|---|---|---|---|---|---|---|---|
| Snowplow |
|
|
|
|
|
|||||
| Usage Ping |
|
|
|
|
|
|||||
| Database import |
|
|
|
|
|
|
Legend
SaaS = GitLab.com. SM = Self-Managed instance
Reporting time period
Our reporting time periods varies by segment. For example, on Self-Managed Users, we can report all time counts and 28 day counts in Usage Ping.
| Reporting Time Period | All Time | 28 Days | 7 Days | Daily |
|---|---|---|---|---|
| Snowplow | ||||
| Usage Ping |
|
|||
| Database import |
Legend
Systems overview
The systems overview is a simplified diagram showing the interactions between GitLab Inc and self-managed instances.
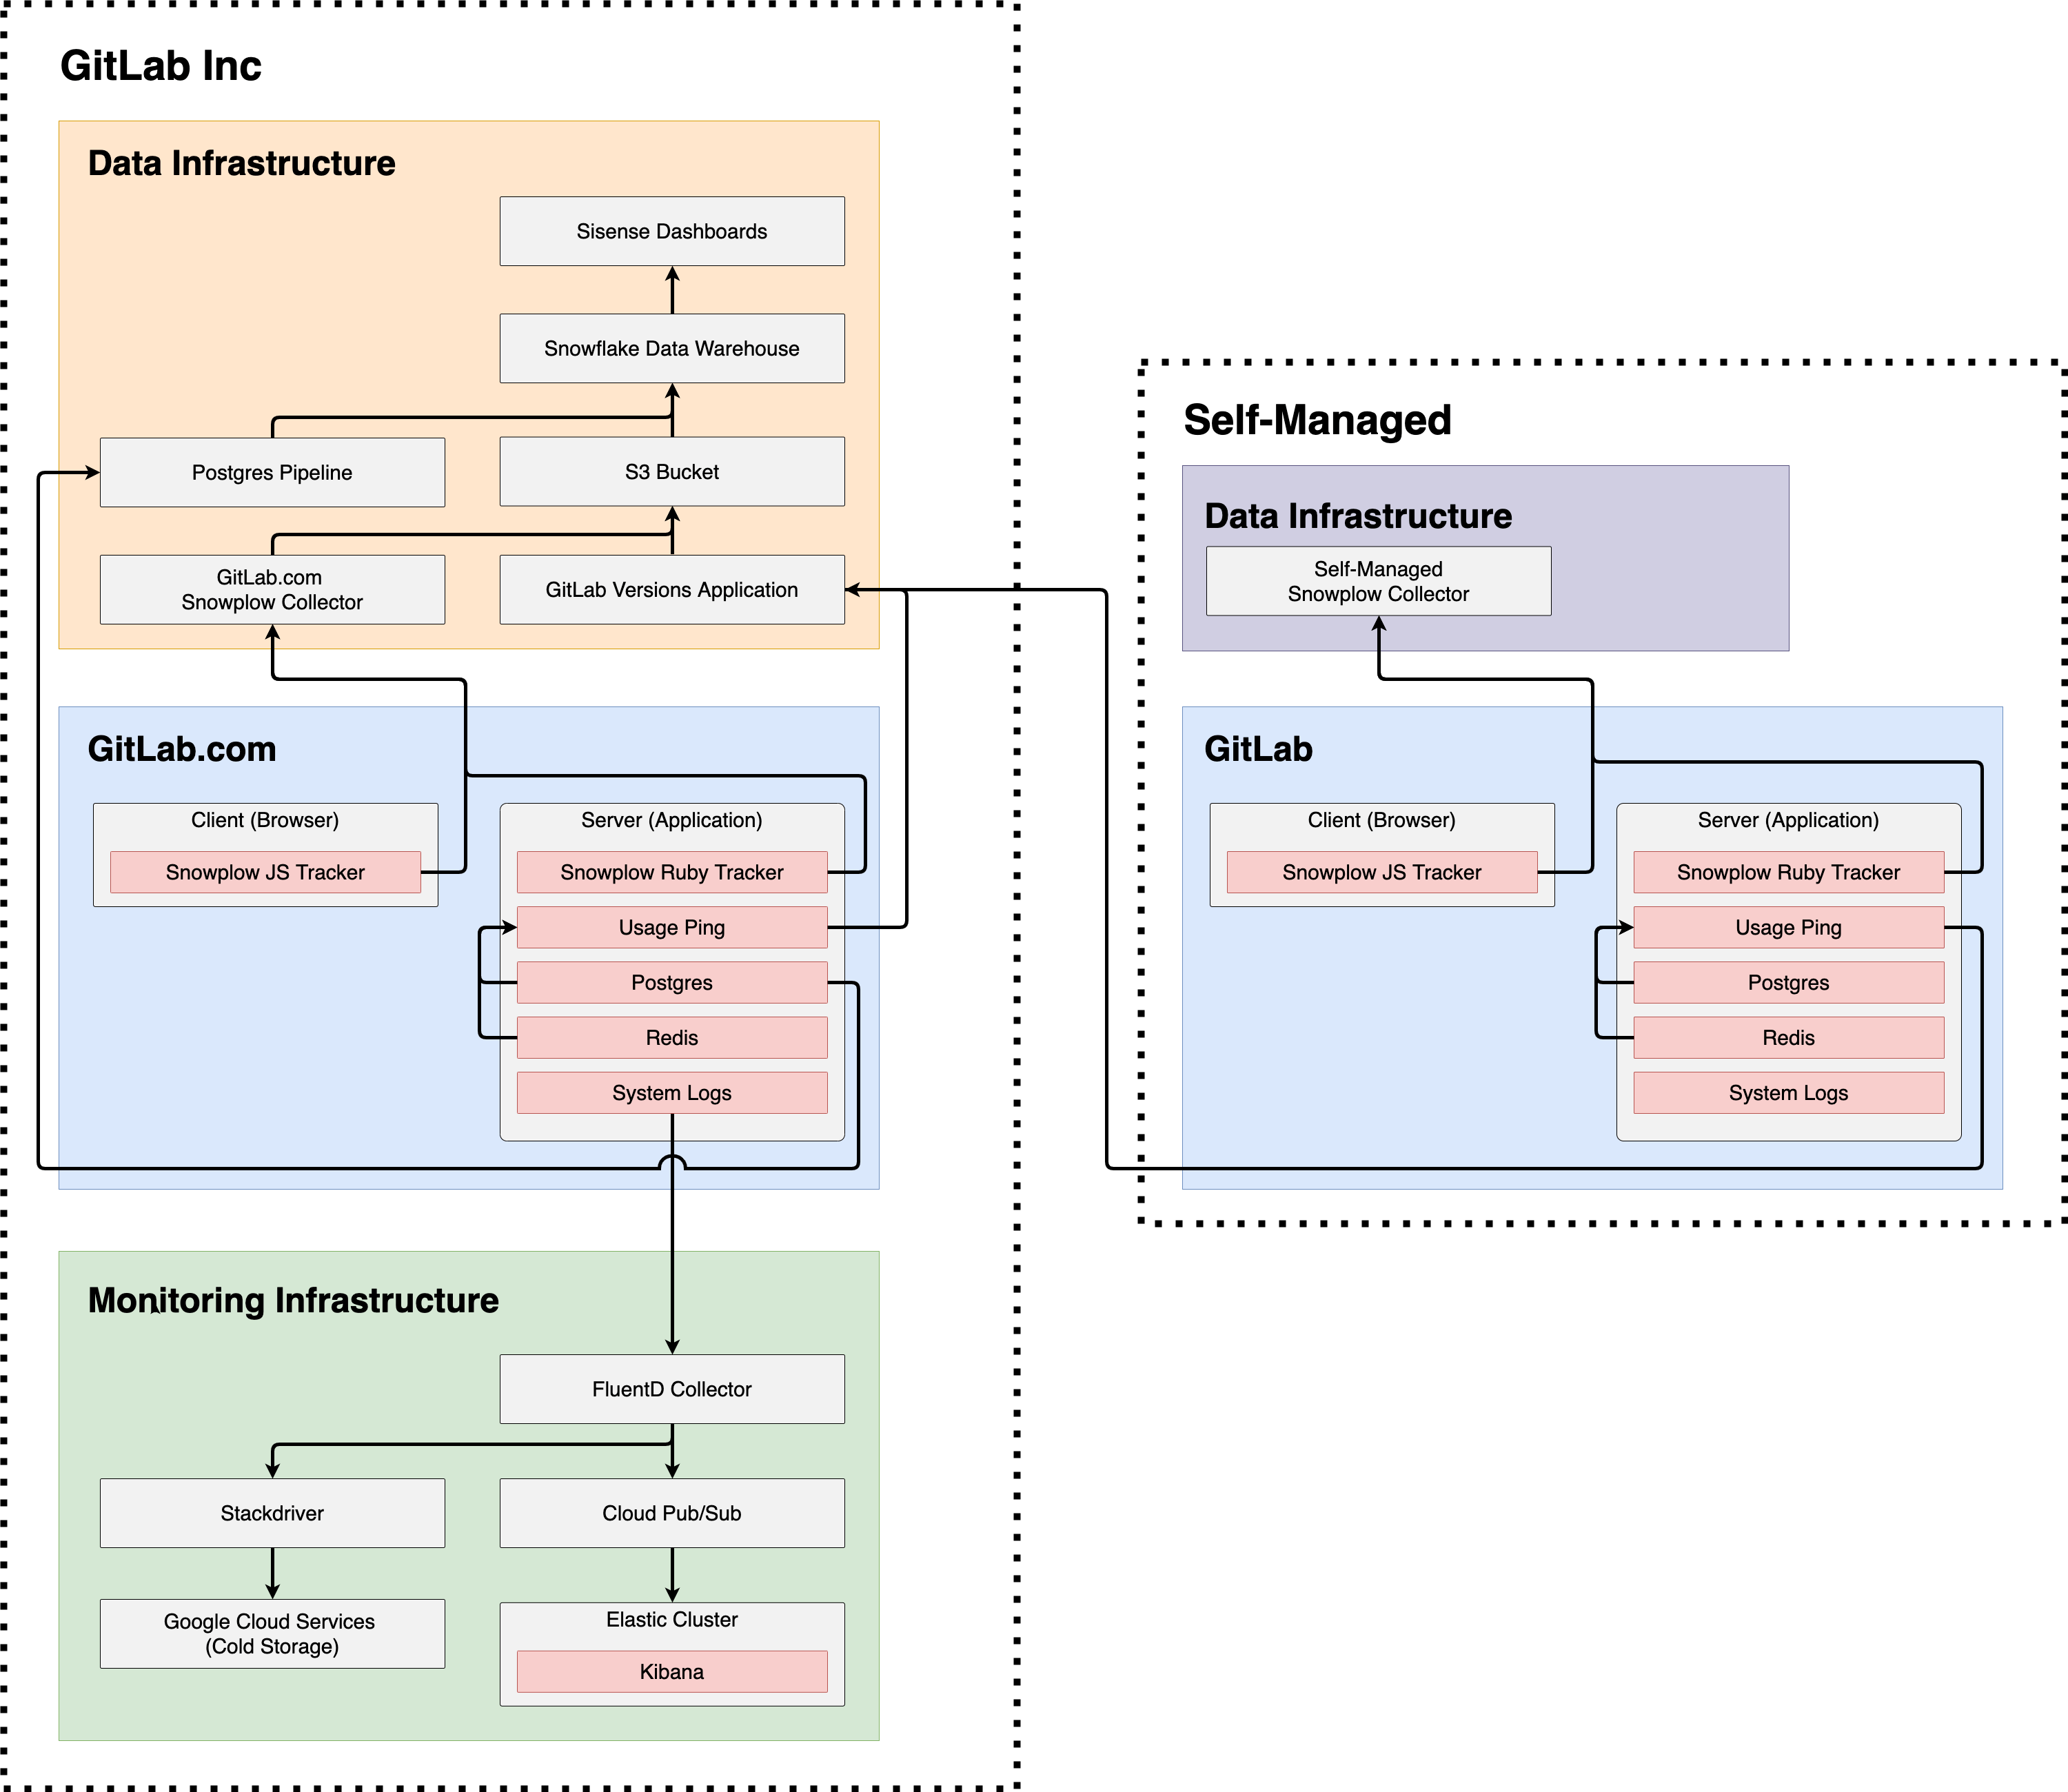
GitLab Inc
For Telemetry purposes, GitLab Inc has three major components:
- Data Infrastructure: This contains everything managed by our data team including Sisense Dashboards for visualization, Snowflake for Data Warehousing, incoming data sources such as PostgreSQL Pipeline and S3 Bucket, and lastly our data collectors GitLab.com's Snowplow Collector and GitLab's Versions Application.
- GitLab.com: This is the production GitLab application which is made up of a Client and Server. On the Client or browser side, a Snowplow JS Tracker (Frontend) is used to track client-side events. On the Server or application side, a Snowplow Ruby Tracker (Backend) is used to track server-side events. The server also contains Usage Ping which leverages a PostgreSQL database and a Redis in-memory data store to report on usage data. Lastly, the server also contains System Logs which are generated from running the GitLab application.
- Monitoring infrastructure: This is the infrastructure used to ensure GitLab.com is operating smoothly. System Logs are sent from GitLab.com to our monitoring infrastructure and collected by a FluentD collector. From FluentD, logs are either sent to long term Google Cloud Services cold storage via Stackdriver, or, they are sent to our Elastic Cluster via Cloud Pub/Sub which can be explored in real-time using Kibana.
Self-managed
For Telemetry purposes, self-managed instances have two major components:
- Data infrastructure: Having a data infrastructure setup is optional on self-managed instances. If you'd like to collect Snowplow tracking events for your self-managed instance, you can setup your own self-managed Snowplow collector and configure your Snowplow events to point to your own collector.
- GitLab: A self-managed GitLab instance contains all of the same components as GitLab.com mentioned above.
Differences between GitLab Inc and Self-managed
As shown by the orange lines, on GitLab.com Snowplow JS, Snowplow Ruby, Usage Ping, and PostgreSQL database imports all flow into GitLab Inc's data infrastructure. However, on self-managed, only Usage Ping flows into GitLab Inc's data infrastructure.
As shown by the green lines, on GitLab.com system logs flow into GitLab Inc's monitoring infrastructure. On self-managed, there are no logs sent to GitLab Inc's monitoring infrastructure.
Note (1): Snowplow JS and Snowplow Ruby are available on self-managed, however, the Snowplow Collector endpoint is set to a self-managed Snowplow Collector which GitLab Inc does not have access to.
Additional information
More useful links: