GitLab Security Dashboard (ULTIMATE)
The Security Dashboard is a good place to get an overview of all the security vulnerabilities in your groups, projects, and pipelines.
You can also drill down into a vulnerability and get extra information. This includes the project it comes from, any related file(s), and metadata that helps you analyze the risk it poses. You can also dismiss a vulnerability or create an issue for it.
To benefit from the Security Dashboard you must first configure one of the security scanners.
Supported reports
The Security Dashboard displays vulnerabilities detected by scanners such as:
- Container Scanning
- Dynamic Application Security Testing
- Dependency Scanning
- Static Application Security Testing
- And others!
Requirements
To use the instance, group, project, or pipeline security dashboard:
- At least one project inside a group must be configured with at least one of the supported reports.
- The configured jobs must use the new
reportssyntax. - GitLab Runner 11.5 or newer must be used. If you're using the shared runners on GitLab.com, this is already the case.
Pipeline Security
Introduced in GitLab Ultimate 12.3.
At the pipeline level, the Security section displays the vulnerabilities present in the branch of the project the pipeline was run against.
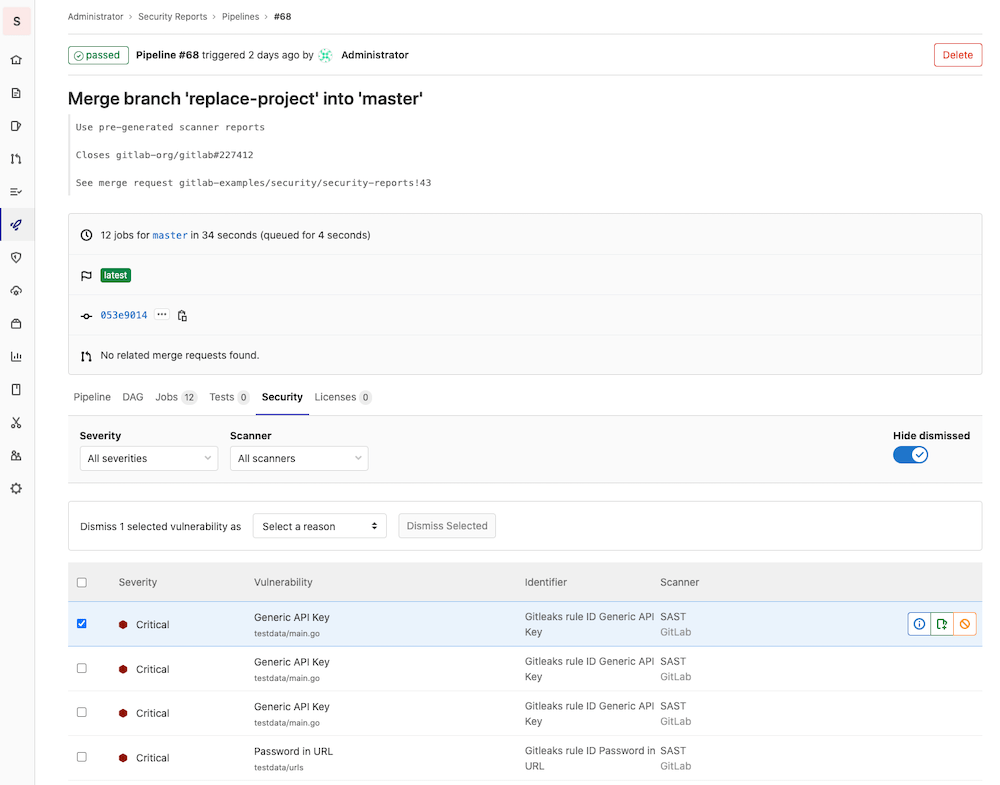
Visit the page for any pipeline that ran any of the supported reports. To view the pipeline's security findings, select the Security tab when viewing the pipeline.
NOTE: Note: A pipeline consists of multiple jobs, including SAST and DAST scanning. If any job fails to finish for any reason, the security dashboard will not show SAST scanner output. For example, if the SAST job finishes but the DAST job fails, the security dashboard will not show SAST results. The analyzer will output an exit code on failure.
Project Security Dashboard
Introduced in GitLab Ultimate 11.1.
At the project level, the Security Dashboard displays the vulnerabilities merged into your project's default branch. Access it by navigating to Security & Compliance > Security Dashboard. By default, the Security Dashboard displays all detected and confirmed vulnerabilities.
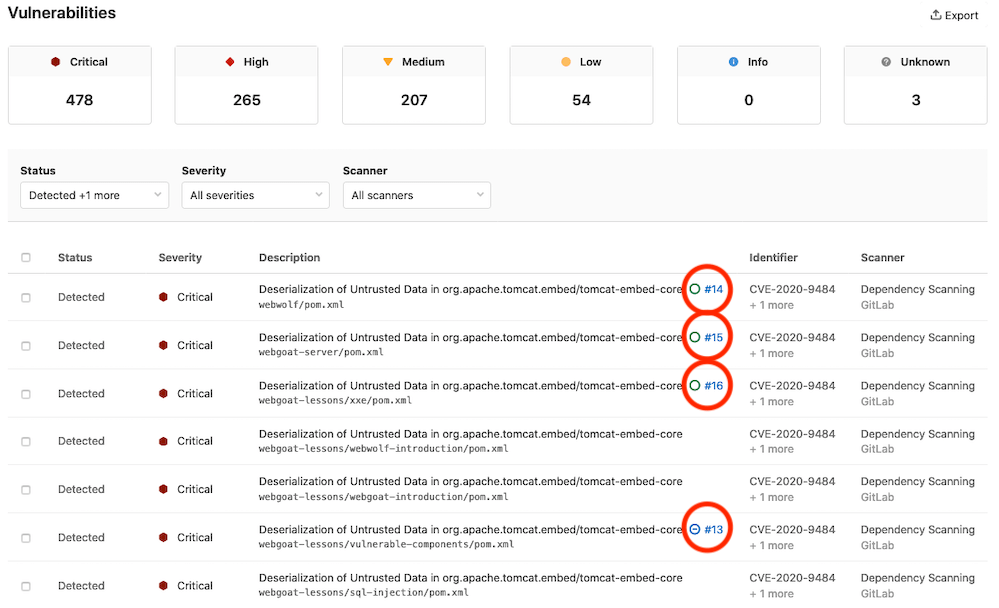
The Security Dashboard first displays the total number of vulnerabilities by severity (for example, Critical, High, Medium, Low, Info, Unknown). Below this, a table shows each vulnerability's status, severity, and description. Clicking a vulnerability takes you to its Vulnerability Details page to view more information about that vulnerability.
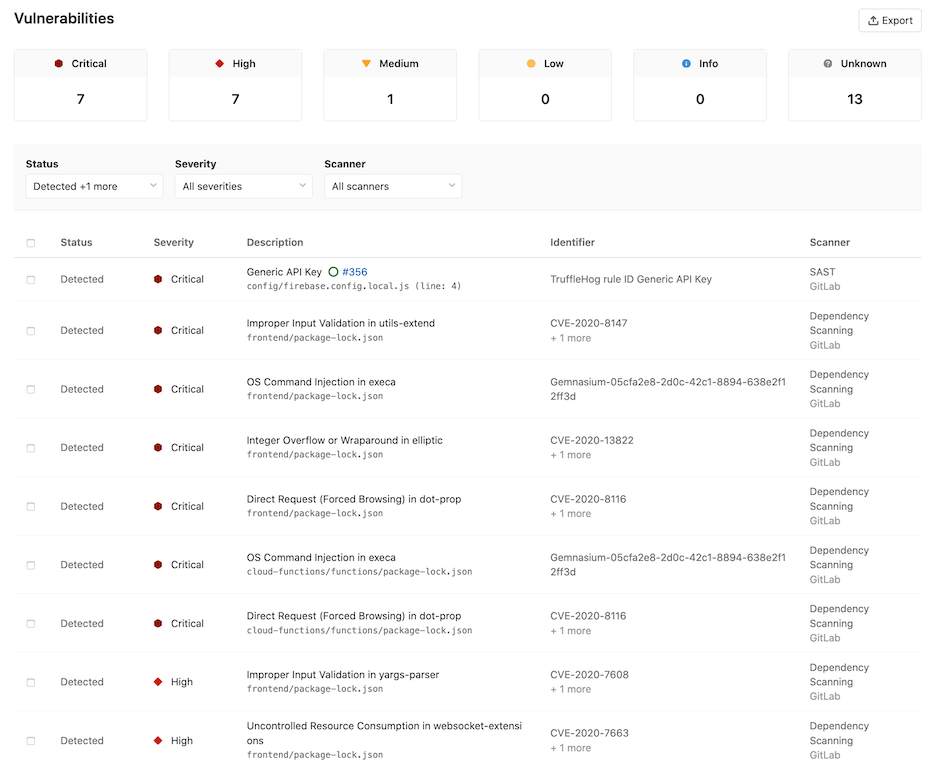
You can filter the vulnerabilities by one or more of the following:
- Status
- Severity
- Scanner
You can also dismiss vulnerabilities in the table:
- Select the checkbox for each vulnerability you want to dismiss.
- In the menu that appears, select the reason for dismissal and click Dismiss Selected.
Group Security Dashboard
Introduced in GitLab Ultimate 11.5.
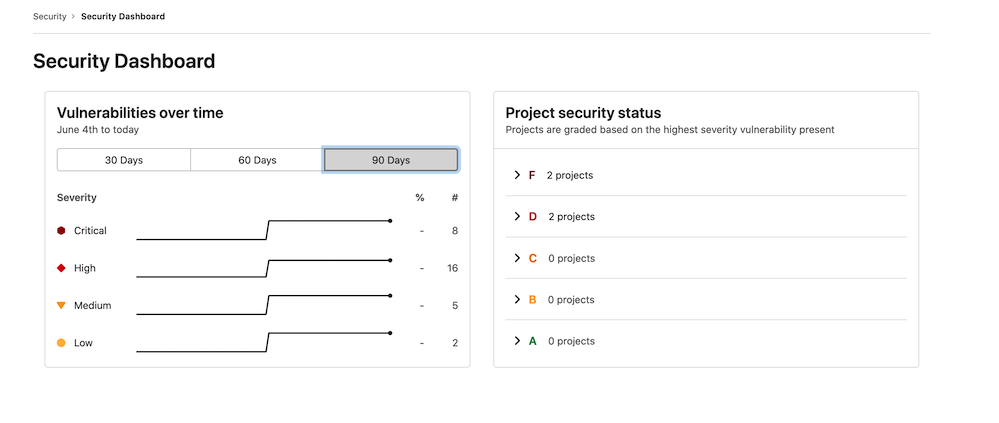
The group Security Dashboard gives an overview of the vulnerabilities in the default branches of the projects in a group and its subgroups. Access it by navigating to Security > Security Dashboard for your group. By default, the Security Dashboard displays all detected and confirmed vulnerabilities.
NOTE: Note: The Security Dashboard only shows projects with security reports enabled in a group.
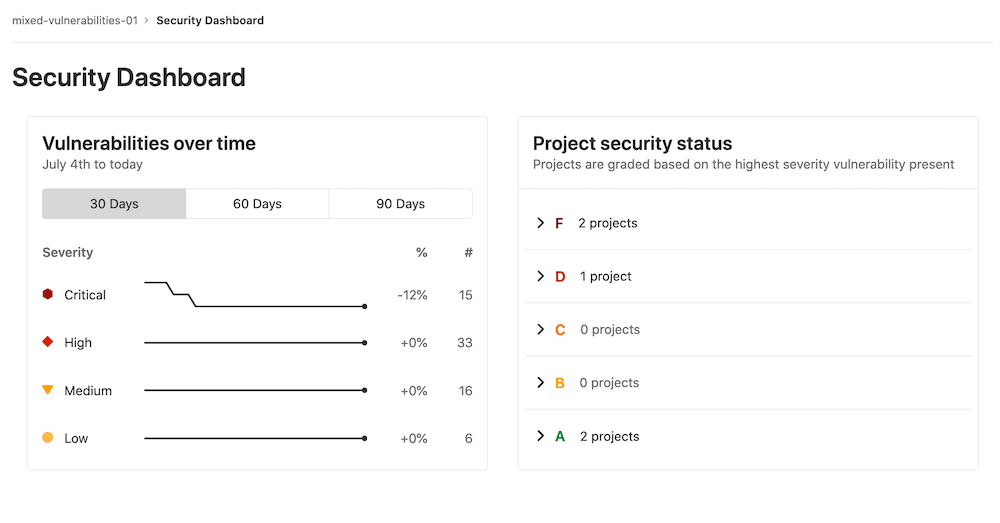
There is a timeline chart that shows how many open vulnerabilities your projects had at various points in time. You can filter among 30, 60, and 90 days, with the default being 90. Hover over the chart to get more details about the open vulnerabilities at a specific time.
Next to the timeline chart is a list of projects, grouped and sorted by the severity of the vulnerability found:
- F: 1 or more "critical"
- D: 1 or more "high" or "unknown"
- C: 1 or more "medium"
- B: 1 or more "low"
- A: 0 vulnerabilities
Projects with no vulnerability tests configured will not appear in the list. Additionally, dismissed vulnerabilities are not included either.
Navigate to the group's Vulnerability Report to view the vulnerabilities found.
Instance Security Dashboard
Introduced in GitLab Ultimate 12.8.
At the instance level, the Security Dashboard displays the vulnerabilities present in the default branches of all the projects you configure to display on the dashboard. It includes all the group Security Dashboard's features.
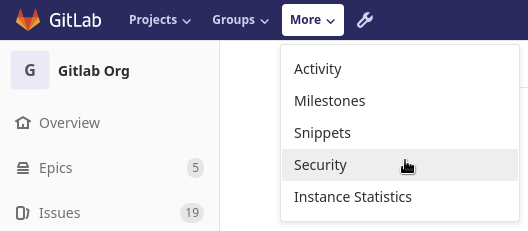
You can access the Instance Security Dashboard from the menu bar at the top of the page. Under More, select Security.
The dashboard is empty before you add projects to it.
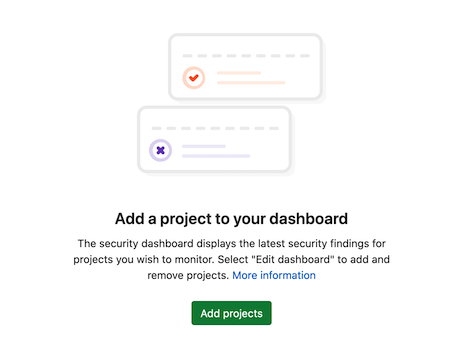
Adding projects to the dashboard
To add projects to the dashboard:
- Click Settings in the left navigation bar or click the Add projects button.
- Search for and add one or more projects using the Search your projects field.
- Click the Add projects button.
After you add projects, the Security Dashboard displays the vulnerabilities found in those projects' default branches.
Export vulnerabilities
Introduced in GitLab Ultimate 12.10.
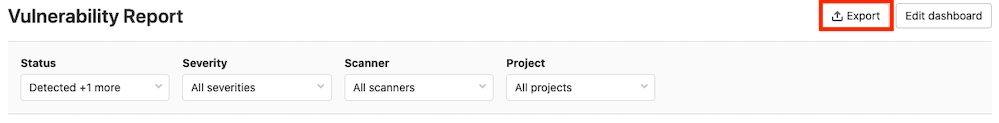
You can export all your vulnerabilities in CSV format by clicking the {upload} Export button located at top right of the Security Dashboard. After the report is built, the CSV report downloads to your local machine. The report contains all vulnerabilities for the projects defined in the Security Dashboard, as filters don't apply to the export function.
NOTE: Note: It may take several minutes for the download to start if your project contains thousands of vulnerabilities. Do not close the page until the download finishes.
Keeping the dashboards up to date
The Security Dashboard displays information from the results of the most recent security scan on the default branch, which means that security scans are performed every time the branch is updated.
If the default branch is updated infrequently, scans are run infrequently and the information on the Security Dashboard can become outdated as new vulnerabilities are discovered.
To ensure the information on the Security Dashboard is regularly updated, configure a scheduled pipeline to run a daily security scan. This will update the information displayed on the Security Dashboard regardless of how often the default branch is updated.
That way, reports are created even if no code change happens.
CAUTION: Warning: Running Dependency Scanning from a scheduled pipeline might result in false negatives if your project doesn't have a lock file and isn't configured for Continuous Delivery. A lock file is a file that lists all transient dependencies and keeps track of their exact versions. The false negative can occur because the dependency version resolved during the scan might differ from the ones resolved when your project was built and released, in a previous pipeline. Java projects can't have lock files. Python projects can have lock files, but GitLab Secure tools don't support them.
Security scans using Auto DevOps
When using Auto DevOps, use special environment variables to configure daily security scans.
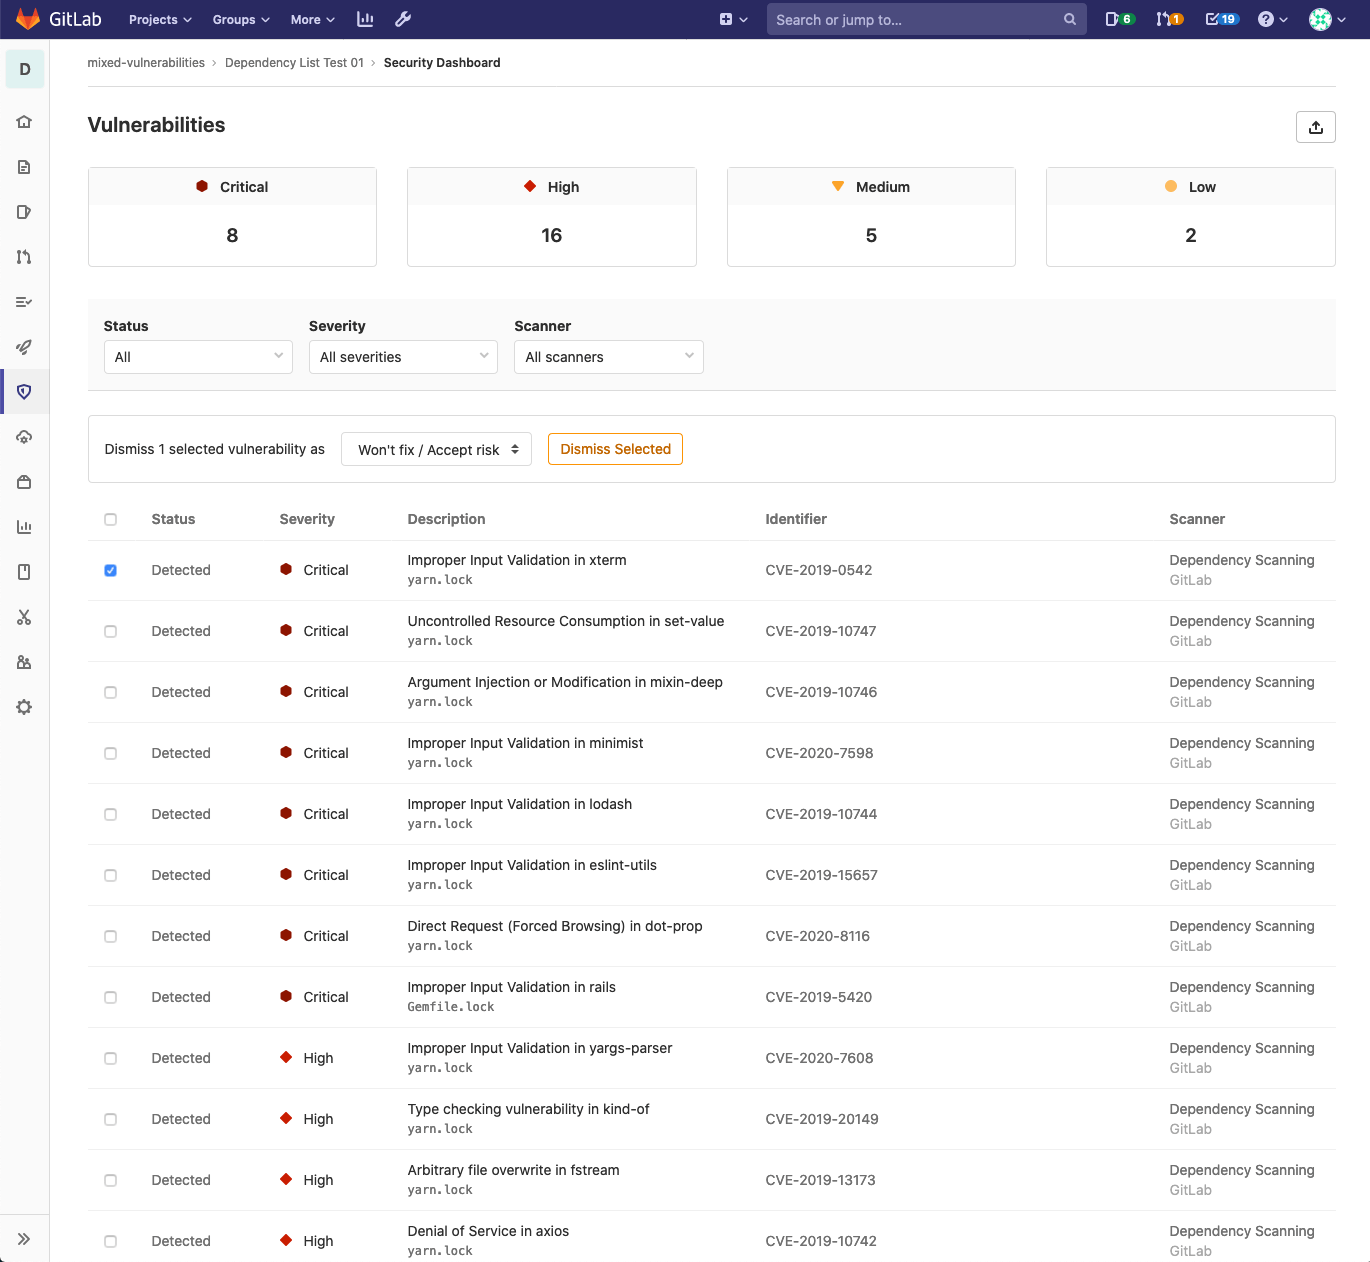
Vulnerability list
Each dashboard's vulnerability list contains vulnerabilities from the latest scans that were merged into the default branch.
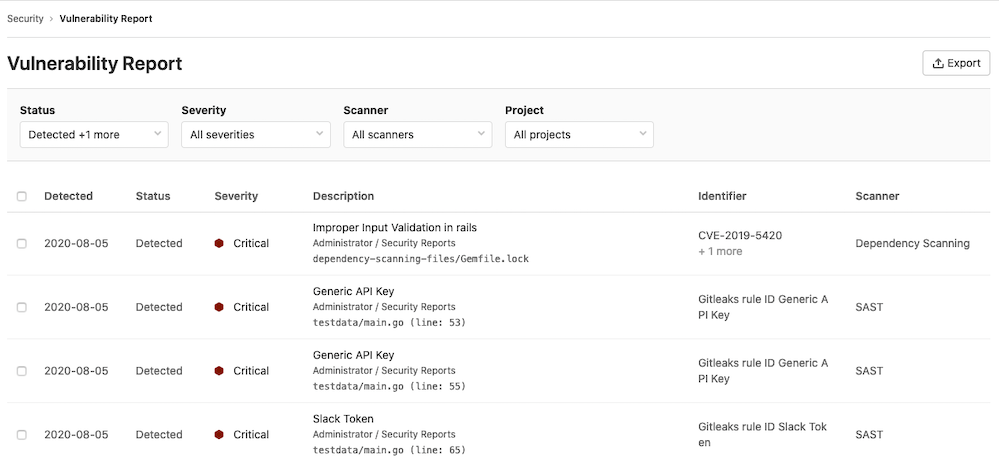
You can filter which vulnerabilities the Security Dashboard displays by:
- Status
- Severity
- Scanner
- Project
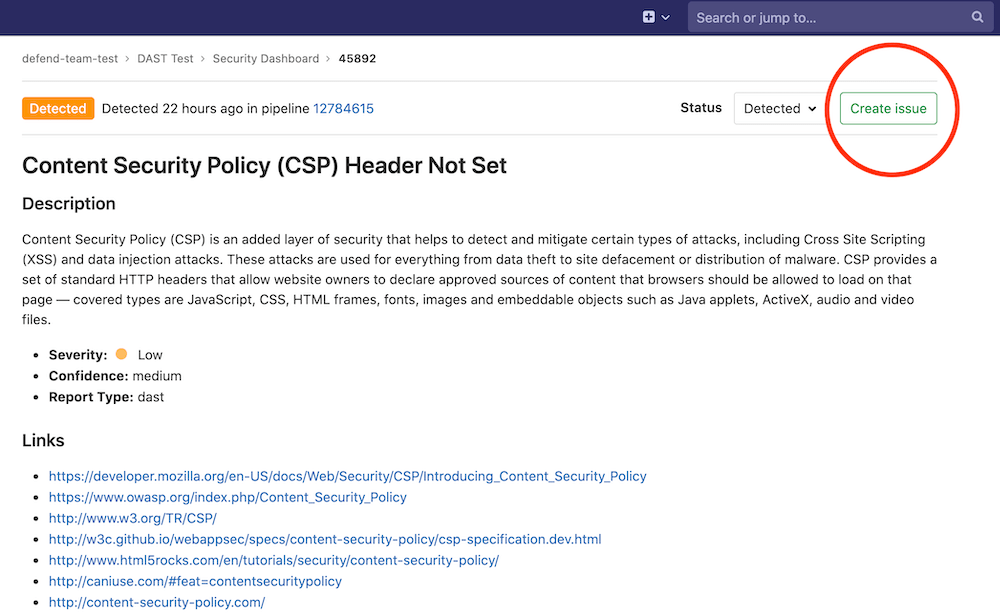
Clicking any vulnerability in the table takes you to its Vulnerability Details page to see more information on that vulnerability. To create an issue associated with the vulnerability, click the Create Issue button.
Once you create the issue, the vulnerability list contains a link to the issue and an icon whose color indicates the issue's status (green for open issues, blue for closed issues).
Read more on how to interact with the vulnerabilities.