Prometheus integration
Introduced in GitLab 9.0.
GitLab offers powerful integration with Prometheus for monitoring key metrics of your apps, directly within GitLab. Metrics for each environment are retrieved from Prometheus, and then displayed within the GitLab interface.
There are two ways to set up Prometheus integration, depending on where your apps are running:
- For deployments on Kubernetes, GitLab can automatically deploy and manage Prometheus.
- For other deployment targets, simply specify the Prometheus server.
Once enabled, GitLab will automatically detect metrics from known services in the metric library. You can also add your own metrics and create custom dashboards.
Enabling Prometheus Integration
Managed Prometheus on Kubernetes
Introduced in GitLab 10.5.
GitLab can seamlessly deploy and manage Prometheus on a connected Kubernetes cluster, making monitoring of your apps easy.
Requirements
Getting started
Once you have a connected Kubernetes cluster, deploying a managed Prometheus is as easy as a single click.
- Go to the Operations > Kubernetes page to view your connected clusters
- Select the cluster you would like to deploy Prometheus to
- Click the Install button to deploy Prometheus to the cluster

About managed Prometheus deployments
Prometheus is deployed into the gitlab-managed-apps namespace, using the official Helm chart. Prometheus is only accessible within the cluster, with GitLab communicating through the Kubernetes API.
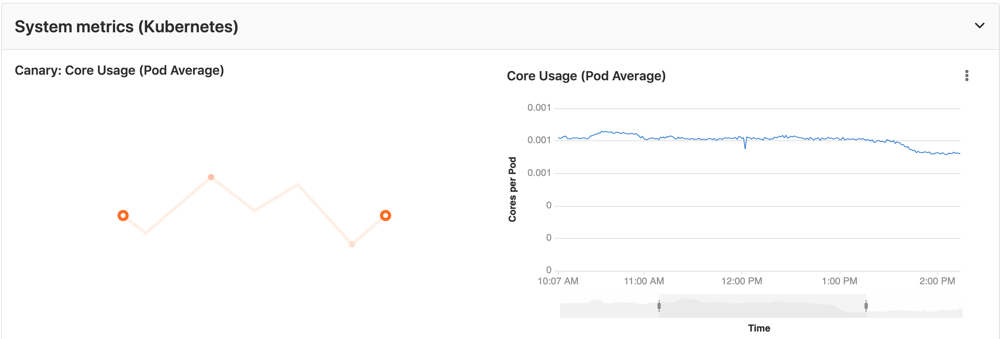
The Prometheus server will automatically detect and monitor nodes, pods, and endpoints. To configure a resource to be monitored by Prometheus, simply set the following Kubernetes annotations:
-
prometheus.io/scrapetotrueto enable monitoring of the resource. -
prometheus.io/portto define the port of the metrics endpoint. -
prometheus.io/pathto define the path of the metrics endpoint. Defaults to/metrics.
CPU and Memory consumption is monitored, but requires naming conventions in order to determine the environment. If you are using Auto DevOps, this is handled automatically.
The NGINX Ingress that is deployed by GitLab to clusters, is automatically annotated for monitoring providing key response metrics: latency, throughput, and error rates.
Manual configuration of Prometheus
Requirements
Integration with Prometheus requires the following:
- GitLab 9.0 or higher
- Prometheus must be configured to collect one of the supported metrics
- Each metric must be have a label to indicate the environment
- GitLab must have network connectivity to the Prometheus server
Getting started
Installing and configuring Prometheus to monitor applications is fairly straightforward.
- Install Prometheus
- Set up one of the supported monitoring targets
- Configure the Prometheus server to collect their metrics
Configuration in GitLab
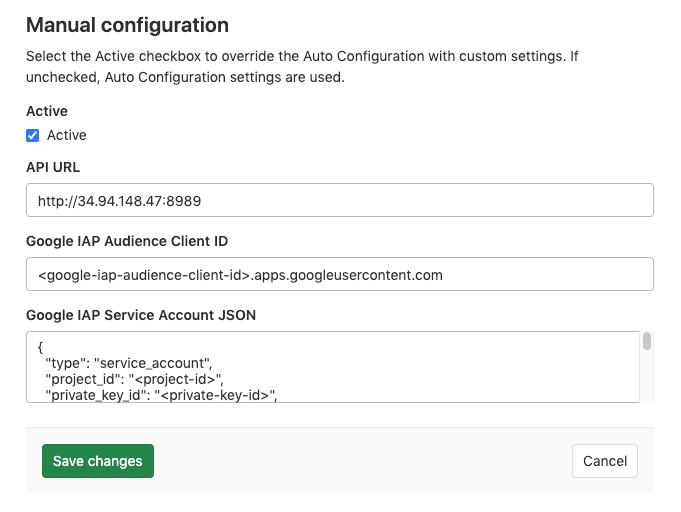
The actual configuration of Prometheus integration within GitLab is very simple. All you will need is the domain name or IP address of the Prometheus server you'd like to integrate with. If the Prometheus resource is secured with Google's Identity-Aware Proxy (IAP), additional information like Client ID and Service Account credentials can be passed which GitLab can use to access the resource. More information about authentication from a service account can be found at Google's documentation for Authenticating from a service account.
- Navigate to the Integrations page at Settings > Integrations.
- Click the Prometheus service.
- For API URL, provide the domain name or IP address of your server, such as
http://prometheus.example.com/orhttp://192.0.2.1/. - (Optional) In Google IAP Audience Client ID, provide the Client ID of the Prometheus OAuth Client secured with Google IAP.
- (Optional) In Google IAP Service Account JSON, provide the contents of the Service Account credentials file that is authorized to access the Prometheus resource.
- Click Save changes.
Thanos configuration in GitLab
You can configure Thanos as a drop-in replacement for Prometheus with GitLab. You will need the domain name or IP address of the Thanos server you'd like to integrate with.
- Navigate to the Integrations page.
- Click the Prometheus service.
- Provide the domain name or IP address of your server, for example
http://thanos.example.com/orhttp://192.0.2.1/. - Click Save changes.
Precedence with multiple Prometheus configurations
Although you can enable both a manual configuration and auto configuration of Prometheus, only one of them will be used:
- If you have enabled a Prometheus manual configuration and a managed Prometheus on Kubernetes, the manual configuration takes precedence and is used to run queries from custom dashboards and custom metrics.
- If you have managed Prometheus applications installed on Kubernetes clusters at different levels (project, group, instance), the order of precedence is described in Cluster precedence.
- If you have managed Prometheus applications installed on multiple Kubernetes clusters at the same level, the Prometheus application of a cluster with a matching environment scope is used.
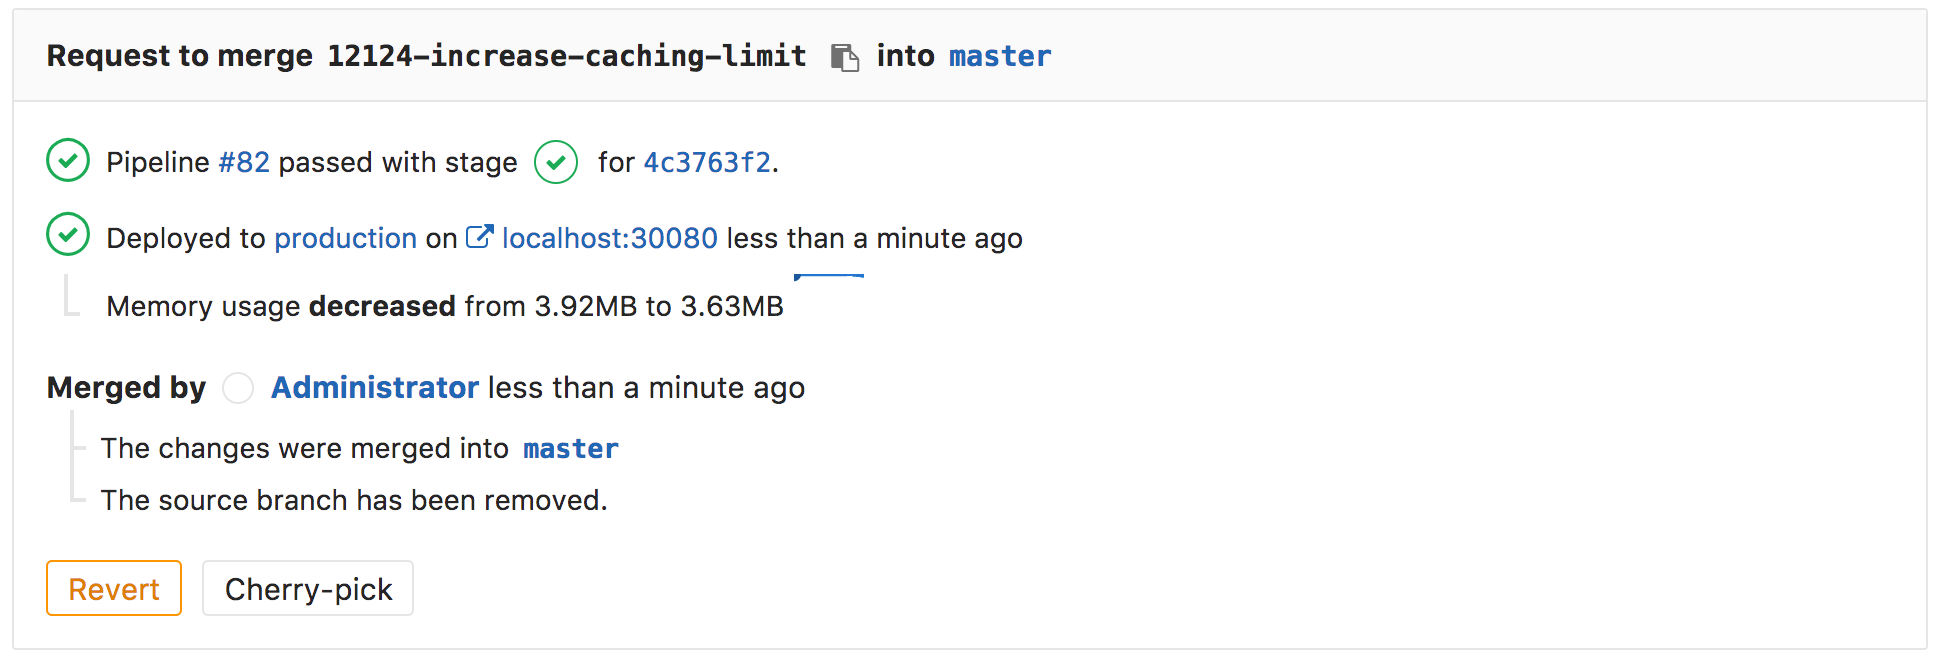
Determining the performance impact of a merge
- Introduced in GitLab 9.2.
- GitLab 9.3 added the numeric comparison of the 30 minute averages.
Developers can view the performance impact of their changes within the merge request workflow.
NOTE: Note: Requires Kubernetes metrics.
When a source branch has been deployed to an environment, a sparkline and numeric comparison of the average memory consumption will appear. On the sparkline, a dot indicates when the current changes were deployed, with up to 30 minutes of performance data displayed before and after. The comparison shows the difference between the 30 minute average before and after the deployment. This information is updated after each commit has been deployed.
Once merged and the target branch has been redeployed, the metrics will switch to show the new environments this revision has been deployed to.
Performance data will be available for the duration it is persisted on the Prometheus server.