Alert details page
Navigate to the Alert details view by visiting the Alert list and selecting an alert from the list. You need least Developer permissions to access alerts.
TIP: Tip: To review live examples of GitLab alerts, visit the alert list for this demo project. Click any alert in the list to examine its alert details page.
Alerts provide Overview and Alert details tabs to give you the right amount of information you need.
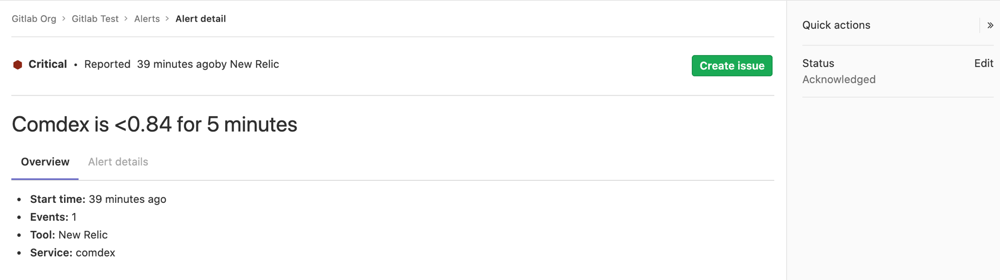
Alert overview tab
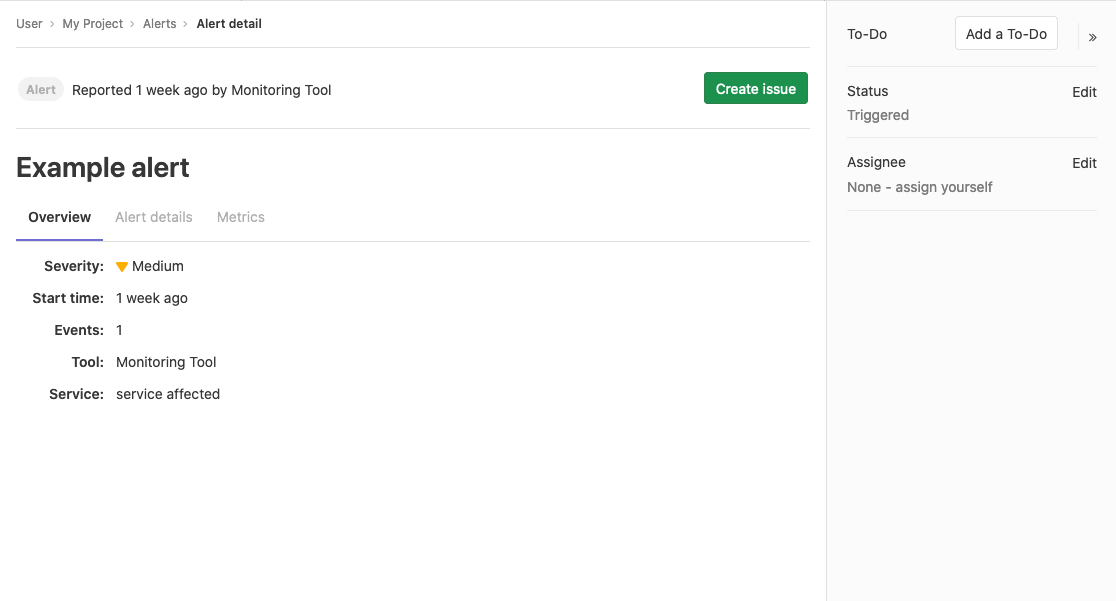
The Overview tab provides basic information about the alert:
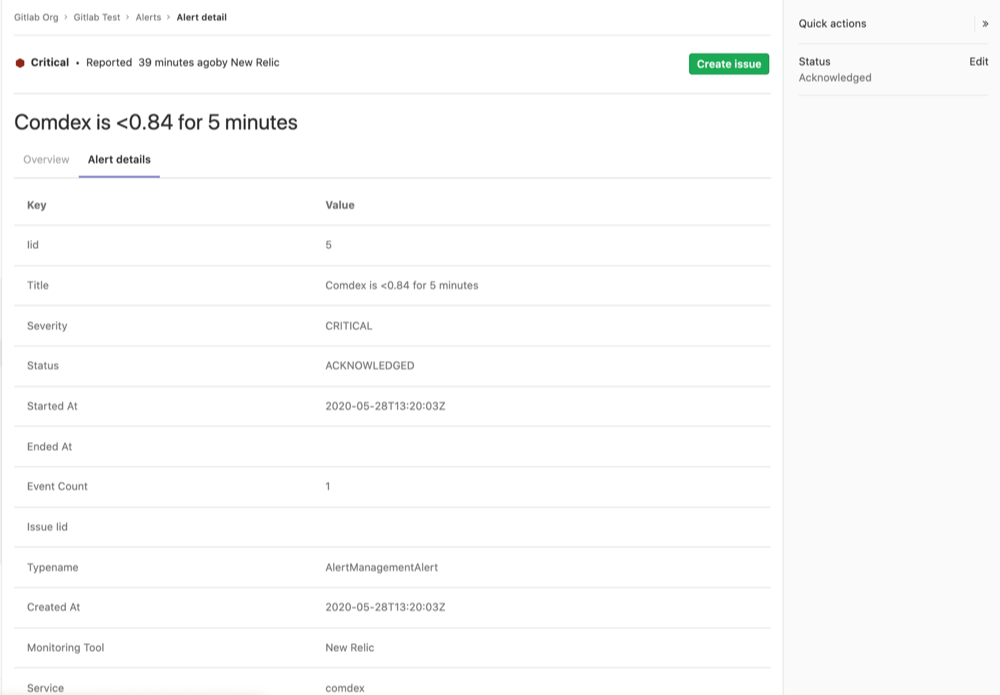
Alert details tab
Update an alert's status
The Alert detail view enables you to update the Alert Status. See Create and manage alerts in GitLab for more details.
Create an issue from an alert
Introduced in GitLab 13.1.
The Alert detail view enables you to create an issue with a description automatically populated from an alert. To create the issue, click the Create Issue button. You can then view the issue from the alert by clicking the View Issue button.
Closing a GitLab issue associated with an alert changes the alert's status to Resolved. See Create and manage alerts in GitLab for more details about alert statuses.
Update an alert's assignee
Introduced in GitLab 13.1.
The Alert detail view allows users to update the Alert assignee.
In large teams, where there is shared ownership of an alert, it can be difficult to track who is investigating and working on it. The Alert detail view enables you to update the Alert assignee:
NOTE: Note: GitLab currently only supports a single assignee per alert.
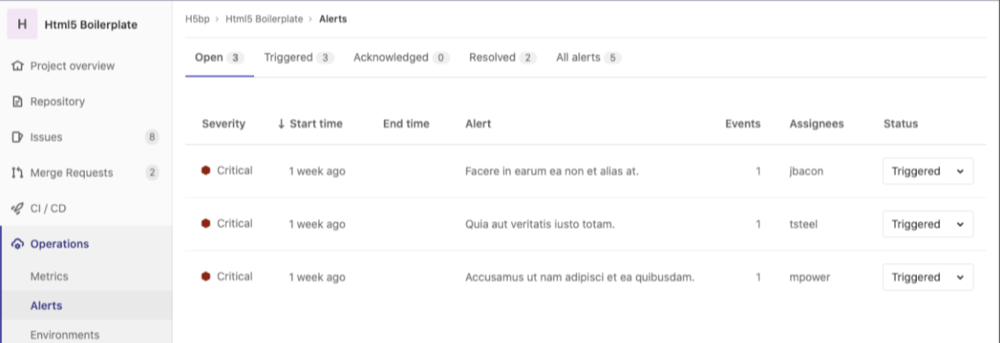
-
To display the list of current alerts, click {cloud-gear} Operations > Alerts:

-
Select your desired alert to display its Alert Details View:
-
If the right sidebar is not expanded, click {angle-double-right} Expand sidebar to expand it.
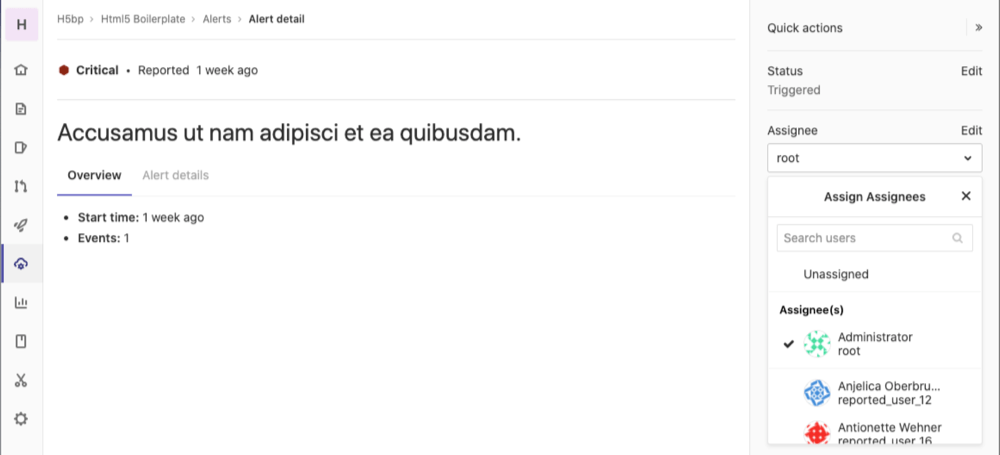
-
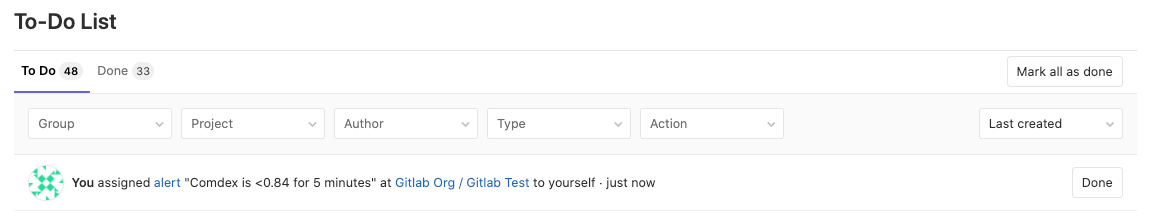
In the right sidebar, locate the Assignee and click Edit. From the dropdown menu, select each user you want to assign to the alert. GitLab creates a to-do list item for each user.
To remove an assignee, click Edit next to the Assignee dropdown menu and deselect the user from the list of assignees, or click Unassigned.
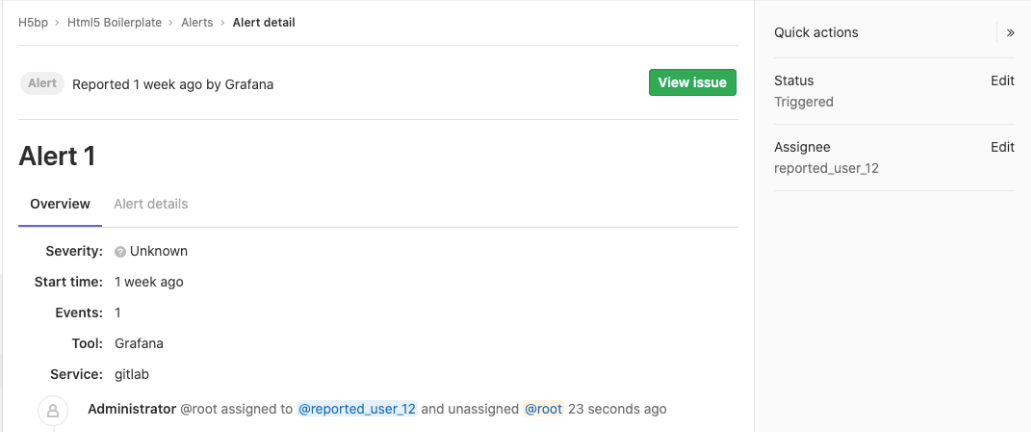
Alert system notes
Introduced in GitLab 13.1.
When you take action on an alert, this is logged as a system note, which is visible in the Alert Details view. This gives you a linear timeline of the alert's investigation and assignment history.
The following actions will result in a system note:
- Updating the status of an alert
- Creating an issue based on an alert
- Assignment of an alert to a user
Create a to-do from an alert
Introduced in GitLab 13.1.
You can manually create To-Do list items for yourself from the Alert details screen, and view them later on your To-Do List. To add a to-do:
-
To display the list of current alerts, click {cloud-gear} Operations > Alerts.
-
Select your desired alert to display its Alert Management Details View.
-
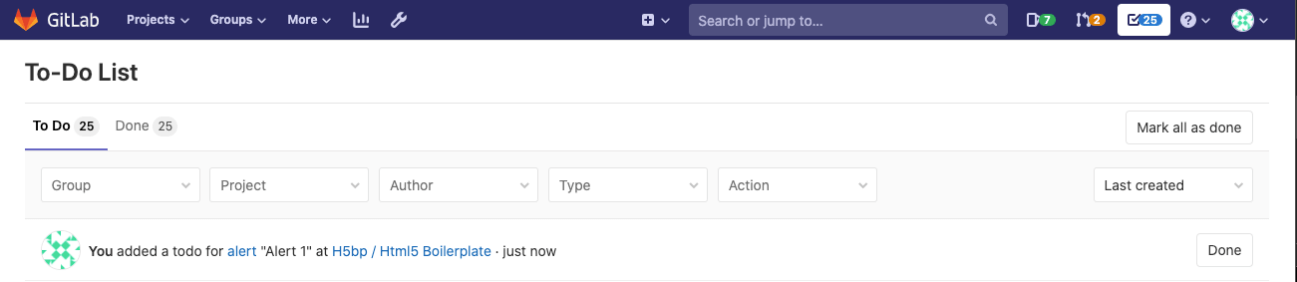
Click the Add a To-Do button in the right sidebar:
Click the To-Do {todo-done} in the navigation bar to view your current to-do list.
View an alert's metrics data
Introduced in GitLab 13.2.
To view the metrics for an alert:
- Sign in as a user with Developer or higher permissions.
- Navigate to {cloud-gear} Operations > Alerts.
- Click the alert you want to view.
- Below the title of the alert, click the Metrics tab.
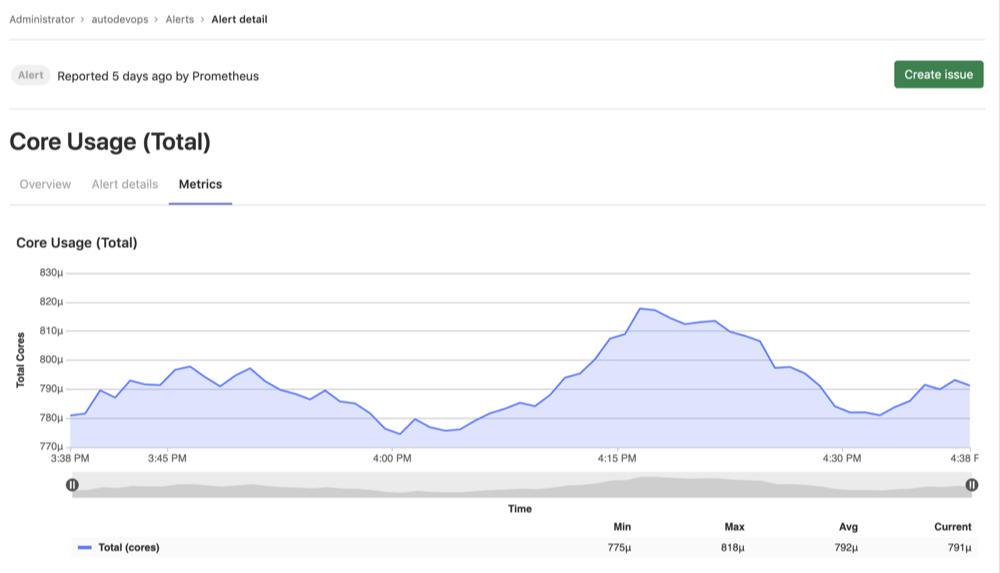
For GitLab-managed Prometheus instances, metrics data is automatically available for the alert, making it easy to see surrounding behavior. See Managed Prometheus instances for information on setting up alerts.
For externally-managed Prometheus instances, you can configure your alerting rules to display a chart in the alert. See Embedding metrics based on alerts in incident issues for information on how to appropriately configure your alerting rules. See External Prometheus instances for information on setting up alerts for your self-managed Prometheus instance.
Use cases for assigning alerts
Consider a team formed by different sections of monitoring, collaborating on a single application. After an alert surfaces, it's extremely important to route the alert to the team members who can address and resolve the alert.
Assigning Alerts eases collaboration and delegation. All assignees are shown in your team's work-flows, and all assignees receive notifications, simplifying communication and ownership of the alert.
After completing their portion of investigating or fixing the alert, users can unassign their account from the alert when their role is complete. The alert status can be updated on the Alert list to reflect if the alert has been resolved.
View an alert's logs
Introduced in GitLab 13.3.
To view the logs for an alert:
- Sign in as a user with Developer or higher permissions.
- Navigate to {cloud-gear} Operations > Alerts.
- Click the alert you want to view.
- Below the title of the alert, click the Metrics tab.
- Click the menu of the metric chart to view options.
- Click View logs.
Read View logs from metrics panel for additional information.
Embed metrics in incidents and issues
You can embed metrics anywhere GitLab Markdown is used, such as descriptions, comments on issues, and merge requests. Embedding metrics helps you share them when discussing incidents or performance issues. You can output the dashboard directly into any issue, merge request, epic, or any other Markdown text field in GitLab by copying and pasting the link to the metrics dashboard.
You can embed both GitLab-hosted metrics and Grafana metrics in incidents and issue templates.
Context menu
You can view more details about an embedded metrics panel from the context menu. To access the context menu, click the {ellipsis_v} More actions dropdown box above the upper right corner of the panel. For a list of options, see Chart context menu.
View logs from metrics panel
- Introduced in GitLab Ultimate 12.8.
- Moved to GitLab Core 12.9.
Viewing logs from a metrics panel can be useful if you're triaging an application incident and need to explore logs from across your application. These logs help you understand what is affecting your application's performance and resolve any problems.