Create and manage alerts in GitLab
Users with at least Developer permissions can access the Alert Management list at {cloud-gear} Operations > Alerts in your project's sidebar. The Alert Management list displays alerts sorted by start time, but you can change the sort order by clicking the headers in the Alert Management list. (Introduced in GitLab 13.1.)
The alert list displays the following information:

- Search - The alert list supports a simple free text search on the title, description, monitoring tool, and service fields. (Introduced in GitLab 13.1.)
- Severity - The current importance of a alert and how much attention it should receive. For a listing of all statuses, read Alert Management severity.
-
Start time - How long ago the alert fired. This field uses the standard
GitLab pattern of
X time ago, but is supported by a granular date/time tooltip depending on the user's locale. - Alert description - The description of the alert, which attempts to capture the most meaningful data.
- Event count - The number of times that an alert has fired.
- Issue - A link to the incident issue that has been created for the alert.
-
Status - The current status of the alert:
- Triggered: No one has begun investigation.
- Acknowledged: Someone is actively investigating the problem.
- Resolved: No further work is required.
TIP: Tip: Check out a live example in GitLab to examine alerts in action.
Enable Alerts
NOTE: Note: You need at least Maintainer permissions to enable the Alerts feature.
There are several ways to accept alerts into your GitLab project. Enabling any of these methods enables the Alert list. After configuring alerts, visit {cloud-gear} Operations > Alerts in your project's sidebar to view the list of alerts.
Enable GitLab-managed Prometheus alerts
You can install the GitLab-managed Prometheus application on your Kubernetes cluster. For more information, read Managed Prometheus on Kubernetes. When GitLab-managed Prometheus is installed, the Alerts list is also enabled.
To populate the alerts with data, read GitLab-Managed Prometheus instances.
Enable external Prometheus alerts
You can configure an externally-managed Prometheus instance to send alerts to GitLab. To set up this configuration, read the configuring Prometheus documentation. Activating the external Prometheus configuration also enables the Alerts list.
To populate the alerts with data, read External Prometheus instances.
Enable a Generic Alerts endpoint
GitLab provides the Generic Alerts endpoint so you can accept alerts from a third-party alerts service. Read the instructions for toggling generic alerts to add this option. After configuring the endpoint, the Alerts list is enabled.
To populate the alerts with data, read Customizing the payload for requests to the alerts endpoint.
Opsgenie integration (PREMIUM)
Introduced in GitLab Premium 13.2.
A new way of monitoring Alerts via a GitLab integration is with Opsgenie.
NOTE: Note: If you enable the Opsgenie integration, you can't have other GitLab alert services, such as Generic Alerts or Prometheus alerts, active at the same time.
To enable Opsgenie integration:
- Sign in as a user with Maintainer or Owner permissions.
- Navigate to {cloud-gear} Operations > Alerts.
- In the Integrations select box, select Opsgenie.
- Click the Active toggle.
- In the API URL, enter the base URL for your Opsgenie integration, such
as
https://app.opsgenie.com/alert/list. - Click Save changes.
After enabling the integration, navigate to the Alerts list page at {cloud-gear} Operations > Alerts, and click View alerts in Opsgenie.
Alert severity
Each level of alert contains a uniquely shaped and color-coded icon to help you identify the severity of a particular alert. These severity icons help you immediately identify which alerts you should prioritize investigating:
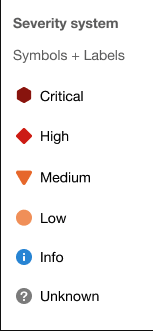
Alerts contain one of the following icons:
| Severity | Icon | Color (hexadecimal) |
|---|---|---|
| Critical | {severity-critical} | #8b2615 |
| High | {severity-high} | #c0341d |
| Medium | {severity-medium} | #fca429 |
| Low | {severity-low} | #fdbc60 |
| Info | {severity-info} | #418cd8 |
| Unknown | {severity-unknown} | #bababa |